Construction Manager Salary in California: $140,787 (2026)
Quick Answer:Across California's 158 metropolitan areas, the average median construction manager pay sits at $140,787/year heading into 2026 — a figure projected from 2025 BLS OEWS wage data for SOC 11-9021. Because California sits at BEA RPP 113.1 (13% above the U.S. baseline), that statewide median translates to roughly $124,480 in nationally-comparable purchasing power. Highest-paying metros: Oakland ($169,809), Sunnyvale ($166,868), Fremont ($166,063).
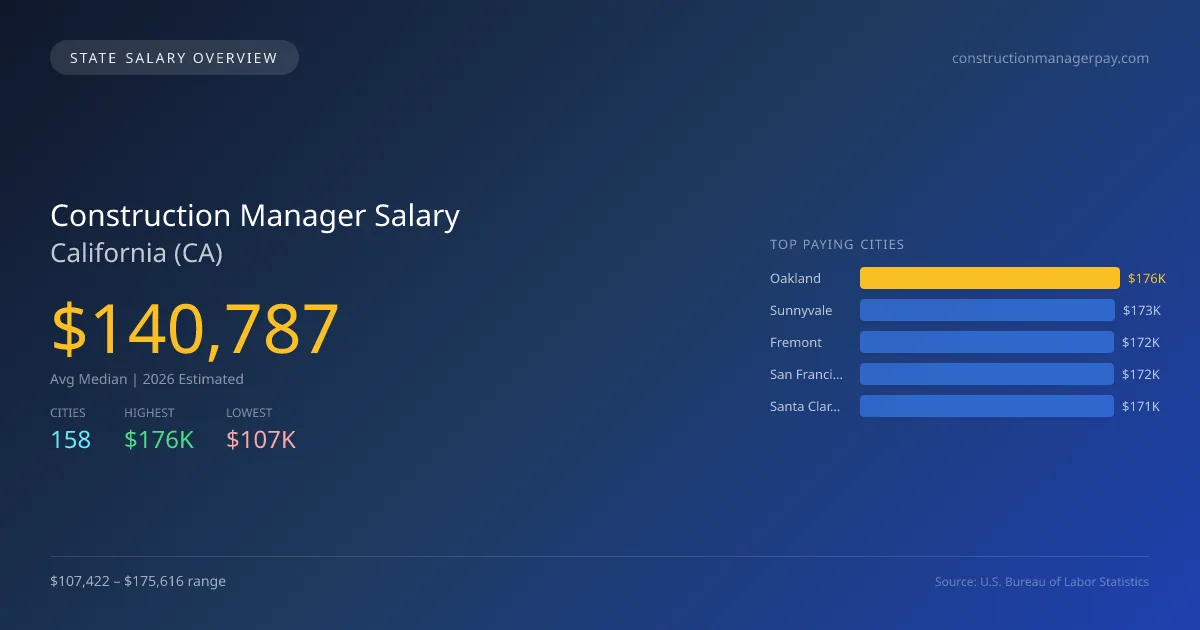
The landscape for construction manager salaries in California is significantly higher than the national average, with a 2026 average median salary of $140,787 compared to the national median of $118,923, reflecting a difference of +18.4%. Salary disparities exist between cities; for example, Oakland leads at $175,616, while Hanford is at the lower end with $107,422, creating a $68,194 gap. This variation is primarily driven by factors such as the cost of living, demand for skilled labor, and the scale of projects in different regions. California's construction managers are subject to specific state licensing requirements and practice laws, which can influence earning potential. The state's robust economy, urban development, and continuous infrastructure projects drive demand, contributing to a projected annual growth rate of 3.42% in employment. Top cities for construction manager employment are Oakland, Sunnyvale at $172,575, Fremont at $171,742, San Francisco at $171,708, and Santa Clara at $171,442. This concentration suggests a strong job market for professionals in this field, especially in metropolitan areas where construction activity is higher. With a total of 36,269 construction managers employed in the state, the outlook remains positive for individuals entering or advancing in this profession.
California Construction Manager Salary Range
Overall salary range in California: $51,224 (lowest entry-level) to $272,206 (highest top earner)
California vs National Average
California construction managers earn 18.39% more than the national median (+$21,864/year difference).
California Construction Manager Salary Distribution (2026)
Construction Manager salaries in California range from $84,959 (entry-level, 10th percentile) to $214,676 (top earners, 90th percentile), with a median of $140,787. The California median is $21,864 above the US national median of $118,923. The average hourly rate is $67.69/hr. Approximately 36,269 construction managers are employed across 158 cities.
2019 BLS Actual
$112,069
2025 BLS Actual
$136,131
2026 Current Est.
$140,787
2019–2027 Growth
+29.9%
Salary Trajectory for Construction Managers in California (2019–2027)
2019–2025: actual BLS OEWS data for this metro area. 2026+: CAGR 3.42% projection.
| Year | Annual Salary | Status |
|---|---|---|
| 2019 | $112,069 | Actual |
| 2020 | $118,460 | Actual |
| 2021 | $109,922 | Actual |
| 2022 | $116,780 | Actual |
| 2023 | $121,835 | Actual |
| 2024 | $133,280 | Actual |
| 2025 | $136,131 | Actual |
| 2026(current) | $140,787 | Estimated |
| 2027 | $145,602 | Projected |
Based on 7 years of BLS OEWS data for the California metropolitan area, the median construction manager salary grew 21.5% from $112,069 (2019) to $136,131 (2025). At a 3.42% compound annual growth rate, salaries are projected to reach $145,602 by 2027 — a total increase of $33,533 (29.92%) from 2019.
Note: Historical values (2019–2025) are actual BLS OEWS figures for the California metropolitan area, sourced from annual Occupational Employment and Wage Statistics surveys. 2026–2026 figures are current estimates, and 2027 values are projections, calculated using a 3.42% CAGR derived from 7-year BLS historical data. Actual salaries may vary based on employer, experience, certifications, and local market conditions.
Top 5 Highest Paying Cities in California
Lowest Paying Cities in California
Best Value Cities for Construction Managers in California
When adjusted for local cost of living, these California cities offer the most purchasing power for construction managers.
| City | Nominal Salary | CoL Index | Adjusted Salary |
|---|---|---|---|
| Oakland | $175,616 | 113.1 | $155,275 |
| San Jose | $168,616 | 110.423 | $152,700 |
| Sunnyvale | $172,575 | 113.1 | $152,586 |
| Fremont | $171,742 | 113.1 | $151,850 |
| Santa Clara | $171,442 | 113.1 | $151,584 |
Adjusted salary = nominal salary × (100 / CoL index). CoL index: 100 = national average. Lower index = lower cost of living.
Salary by Experience Level in California
| Experience Level | Estimated Annual |
|---|---|
| Entry Level (0-2 years) | $84,959 |
| Mid Career (3-7 years) | $140,787 |
| Experienced (7+ years) | $214,676 |
Estimates based on BLS percentile data averaged across California metro areas. Individual pay varies by employer, certifications, and specialization.
All 158 Cities in California
| # | City | Median Salary |
|---|---|---|
| 1 | Oakland | $175,616 |
| 2 | Sunnyvale | $172,575 |
| 3 | Fremont | $171,742 |
| 4 | San Francisco | $171,708 |
| 5 | Santa Clara | $171,442 |
| 6 | San Jose | $168,616 |
| 7 | Napa | $143,475 |
| 8 | Anaheim | $138,608 |
| 9 | Santa Ana | $138,286 |
| 10 | Chula Vista | $137,926 |
| 11 | San Diego | $137,766 |
| 12 | Santa Maria | $137,156 |
| 13 | Long Beach | $136,635 |
| 14 | Carlsbad | $136,614 |
| 15 | Los Angeles | $136,183 |
| 16 | Fontana | $135,727 |
| 17 | Irvine | $135,578 |
| 18 | Oxnard | $135,170 |
| 19 | El Centro | $135,098 |
| 20 | Pomona | $134,917 |
| 21 | Simi Valley | $134,842 |
| 22 | Escondido | $134,811 |
| 23 | Folsom | $134,772 |
| 24 | Thousand Oaks | $134,624 |
| 25 | Fairfield | $134,568 |
| 26 | Fullerton | $134,073 |
| 27 | Daly City | $133,957 |
| 28 | El Monte | $133,914 |
| 29 | Sacramento | $133,867 |
| 30 | Vista | $133,841 |
| 31 | Concord | $133,809 |
| 32 | Clovis | $133,608 |
| 33 | Garden Grove | $133,472 |
| 34 | Temecula | $133,440 |
| 35 | Santa Clarita | $133,351 |
| 36 | Roseville | $133,316 |
| 37 | Lancaster | $133,176 |
| 38 | Inglewood | $133,176 |
| 39 | Santa Cruz | $133,133 |
| 40 | Corona | $133,007 |
| 41 | Richmond | $132,987 |
| 42 | Rialto | $132,924 |
| 43 | Torrance | $132,754 |
| 44 | San Luis Obispo | $132,605 |
| 45 | Elk Grove | $132,502 |
| 46 | Oceanside | $132,470 |
| 47 | Whittier | $132,430 |
| 48 | San Rafael | $132,420 |
| 49 | Rancho Cucamonga | $132,301 |
| 50 | Bakersfield | $132,264 |
| 51 | Hayward | $132,228 |
| 52 | Woodland | $132,194 |
| 53 | Buena Park | $132,173 |
| 54 | Encinitas | $132,162 |
| 55 | Downey | $132,153 |
| 56 | Ontario | $132,108 |
| 57 | Dublin | $132,080 |
| 58 | Redlands | $132,038 |
| 59 | Chino | $131,966 |
| 60 | Westminster | $131,925 |
| 61 | Santa Monica | $131,914 |
| 62 | San Mateo | $131,900 |
| 63 | Tulare | $131,863 |
| 64 | San Buenaventura | $131,816 |
| 65 | Mission Viejo | $131,728 |
| 66 | Moreno Valley | $131,727 |
| 67 | Pleasanton | $131,707 |
| 68 | Pasadena | $131,520 |
| 69 | Santee | $131,428 |
| 70 | Glendale | $131,309 |
| 71 | Mountain View | $131,242 |
| 72 | Pittsburg | $131,232 |
| 73 | Novato | $131,190 |
| 74 | Costa Mesa | $131,141 |
| 75 | Berkeley | $131,004 |
| 76 | Huntington Beach | $130,972 |
| 77 | Jurupa Valley | $130,856 |
| 78 | Hemet | $130,818 |
| 79 | Union City | $130,808 |
| 80 | West Covina | $130,793 |
| 81 | Chino Hills | $130,756 |
| 82 | Gilroy | $130,570 |
| 83 | Yuba City | $130,516 |
| 84 | San Bernardino | $130,512 |
| 85 | San Marcos | $130,497 |
| 86 | Tustin | $130,384 |
| 87 | San Ramon | $130,373 |
| 88 | Riverside | $130,351 |
| 89 | Eastvale | $130,250 |
| 90 | Murrieta | $130,245 |
| 91 | Vacaville | $130,245 |
| 92 | Brentwood | $130,188 |
| 93 | Hesperia | $130,126 |
| 94 | Lake Elsinore | $130,116 |
| 95 | Modesto | $130,102 |
| 96 | Citrus Heights | $129,950 |
| 97 | El Cajon | $129,833 |
| 98 | San Clemente | $129,795 |
| 99 | Bellflower | $129,743 |
| 100 | Palmdale | $129,686 |
| 101 | La Mirada | $129,685 |
| 102 | Apple Valley | $129,661 |
| 103 | Menifee | $129,622 |
| 104 | Yucaipa | $129,568 |
| 105 | Norwalk | $129,559 |
| 106 | Rancho Cordova | $129,444 |
| 107 | Montebello | $129,319 |
| 108 | Compton | $129,268 |
| 109 | Porterville | $129,175 |
| 110 | Lompoc | $129,158 |
| 111 | Santa Rosa | $128,965 |
| 112 | Hawthorne | $128,958 |
| 113 | Antioch | $128,916 |
| 114 | Burbank | $128,906 |
| 115 | Alhambra | $128,606 |
| 116 | Livermore | $128,606 |
| 117 | Orange | $128,568 |
| 118 | South Gate | $128,565 |
| 119 | Victorville | $128,537 |
| 120 | West Sacramento | $128,492 |
| 121 | Poway | $128,459 |
| 122 | San Leandro | $128,285 |
| 123 | Indio | $128,142 |
| 124 | Lake Forest | $128,142 |
| 125 | Carson | $127,914 |
| 126 | Rocklin | $127,893 |
| 127 | Petaluma | $127,732 |
| 128 | Newport Beach | $127,676 |
| 129 | Redwood City | $127,666 |
| 130 | Turlock | $127,635 |
| 131 | Manteca | $127,593 |
| 132 | Perris | $127,583 |
| 133 | Madera | $127,480 |
| 134 | Baldwin Park | $127,252 |
| 135 | Palo Alto | $127,252 |
| 136 | Lakewood | $127,200 |
| 137 | Beaumont | $126,828 |
| 138 | Vallejo | $126,824 |
| 139 | Tracy | $126,797 |
| 140 | Alameda | $126,756 |
| 141 | Laguna Niguel | $126,725 |
| 142 | Milpitas | $126,663 |
| 143 | Camarillo | $126,394 |
| 144 | Oakley | $126,342 |
| 145 | Davis | $126,311 |
| 146 | Upland | $126,218 |
| 147 | La Habra | $126,033 |
| 148 | Lynwood | $125,981 |
| 149 | Salinas | $124,549 |
| 150 | Stockton | $124,321 |
| 151 | Brea | $123,831 |
| 152 | Chico | $123,752 |
| 153 | Merced | $123,225 |
| 154 | Lodi | $122,605 |
| 155 | Fresno | $122,553 |
| 156 | Redding | $115,313 |
| 157 | Visalia | $107,815 |
| 158 | Hanford | $107,422 |
More California Salary Data
Hourly Rates
Explore construction manager hourly pay in California cities.
Senior / Experienced
Top earner salaries for experienced construction managers.
Compare Cities in California
View all comparisons →Explore More Construction Manager Salary Data
Frequently Asked Questions
How much do construction managers make in California in 2026?
What is the highest paying city for construction managers in California?
How does California construction manager pay compare to the national average?
What is the entry-level construction manager salary in California?
How many construction managers are employed in California?
Which California city offers the best value for construction managers?
Written by Michael Johnson, MS, CCM
Career Analyst
Michael has 10 years of experience in construction management. He specializes in project scheduling and cost control. He works with a mid-sized general contracting firm.
Methodology & Data Source
Statewide salary figures on this page are 2026 projections based on the Bureau of Labor Statistics Occupational Employment and Wage Statistics (OEWS) survey, May 2026 release. A 3.42% compound annual growth rate (CAGR), derived from 6-year national BLS wage trends, was applied to each metro area's reported salary to estimate current 2026 construction manager compensation across California. State averages are employment-weighted across 158 metro areas — larger metro areas with more construction managerscontribute proportionally more to the average, producing figures that better reflect typical compensation. Individual pay varies by city, employer, certifications, and experience.
Data Sources & Methodology
Source: BLS, OEWS, 7-year dataset (–). Per-city data from annual BLS metropolitan area surveys.
2026 figures are projected from 2025 BLS data using a compound annual growth rate (CAGR) of 3.42%, derived from historical BLS wage trends for construction managers (SOC 11-9021).
Compiled and verified by Michael Johnson, MS, CCM, a licensed construction manager with 10+ years of clinical experience. · View source data at BLS.gov