Construction Manager Salary in New York: $158,339 (2026)
Quick Answer:Across New York's 39 metropolitan areas, the average median construction manager pay sits at $158,339/year heading into 2026 — a figure projected from 2025 BLS OEWS wage data for SOC 11-9021. Because New York sits at BEA RPP 115.9 (16% above the U.S. baseline), that statewide median translates to roughly $136,617 in nationally-comparable purchasing power. Highest-paying metros: New York ($158,000), Poughkeepsie ($154,442), Kiryas Joel ($152,100).
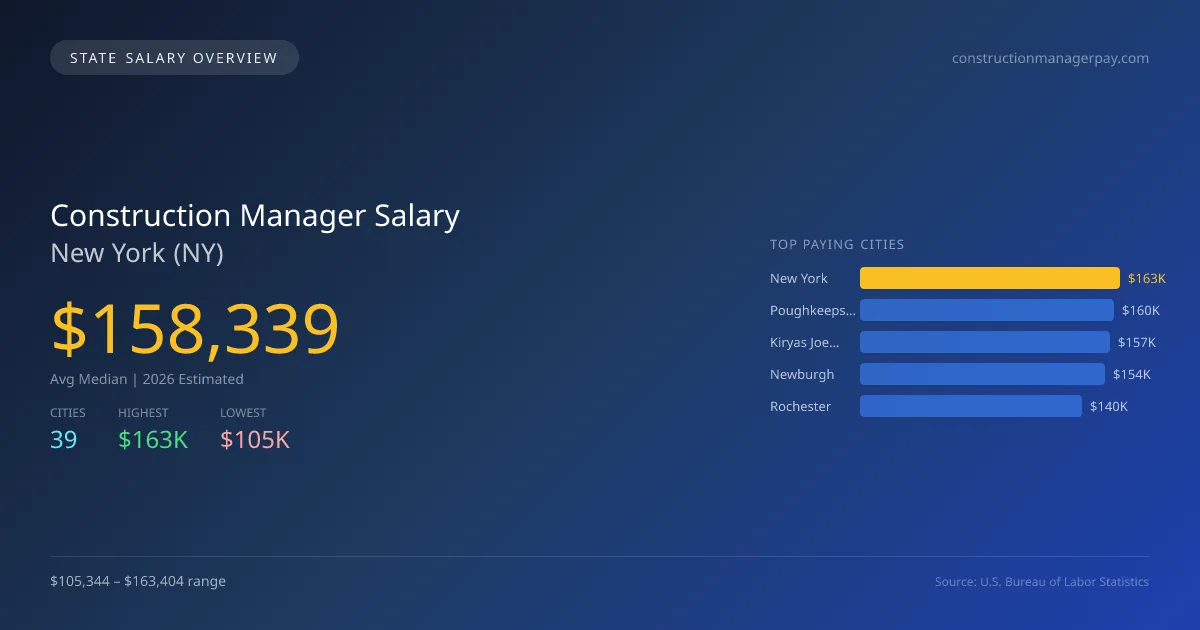
In New York, the projected average median salary for construction managers in 2026 is $158,339, significantly exceeding the national median of $118,923 by 33.1%. The highest-paying city is New York at $163,404, while Kingston offers the lowest at $105,344, highlighting a salary gap of $58,060. This disparity can be attributed to various factors such as cost of living, project sizes, and the density of construction activity in urban areas compared to rural regions. New York state has specific licensing requirements and scope of practice laws that can influence salary levels and career advancement opportunities. Furthermore, a consistent demand for infrastructure development and urban renewal projects is driving job growth in the sector, with an annual compound growth rate of 3.42% projected through 2026. The total employment for construction managers in New York is expected to reach 14,792 in the coming years. The top cities for salaries include Poughkeepsie at $159,724, Kiryas Joel at $157,302, and Newburgh at $153,885, each of which reflects regional economic conditions and housing market dynamics. As the construction industry continues to evolve, opportunities for career advancement and salary growth will remain strong across the state.
New York Construction Manager Salary Range
Overall salary range in New York: $58,908 (lowest entry-level) to $259,088 (highest top earner)
New York vs National Average
New York construction managers earn 33.14% more than the national median (+$39,416/year difference).
New York Construction Manager Salary Distribution (2026)
Construction Manager salaries in New York range from $92,698 (entry-level, 10th percentile) to $250,357 (top earners, 90th percentile), with a median of $158,339. The New York median is $39,416 above the US national median of $118,923. The average hourly rate is $76.12/hr. Approximately 14,792 construction managers are employed across 39 cities.
2019 BLS Actual
$129,396
2025 BLS Actual
$153,103
2026 Current Est.
$158,339
2019–2027 Growth
+26.6%
Salary Trajectory for Construction Managers in New York (2019–2027)
2019–2025: actual BLS OEWS data for this metro area. 2026+: CAGR 3.42% projection.
| Year | Annual Salary | Status |
|---|---|---|
| 2019 | $129,396 | Actual |
| 2020 | $133,595 | Actual |
| 2021 | $127,490 | Actual |
| 2022 | $142,593 | Actual |
| 2023 | $152,589 | Actual |
| 2024 | $136,673 | Actual |
| 2025 | $153,103 | Actual |
| 2026(current) | $158,339 | Estimated |
| 2027 | $163,755 | Projected |
Based on 7 years of BLS OEWS data for the New York metropolitan area, the median construction manager salary grew 18.3% from $129,396 (2019) to $153,103 (2025). At a 3.42% compound annual growth rate, salaries are projected to reach $163,755 by 2027 — a total increase of $34,359 (26.55%) from 2019.
Note: Historical values (2019–2025) are actual BLS OEWS figures for the New York metropolitan area, sourced from annual Occupational Employment and Wage Statistics surveys. 2026–2026 figures are current estimates, and 2027 values are projections, calculated using a 3.42% CAGR derived from 7-year BLS historical data. Actual salaries may vary based on employer, experience, certifications, and local market conditions.
Top 5 Highest Paying Cities in New York
Lowest Paying Cities in New York
| City | Median Salary |
|---|---|
| Kingston | $105,344 |
| Watertown | $107,309 |
| Rome | $117,710 |
| Binghamton | $118,871 |
| Utica | $118,923 |
Best Value Cities for Construction Managers in New York
When adjusted for local cost of living, these New York cities offer the most purchasing power for construction managers.
| City | Nominal Salary | CoL Index | Adjusted Salary |
|---|---|---|---|
| New York | $163,404 | 112.563 | $145,167 |
| Rochester | $139,555 | 97.035 | $143,819 |
| Kiryas Joel | $157,302 | 109.422 | $143,757 |
| Syracuse | $137,300 | 95.742 | $143,406 |
| Poughkeepsie | $159,724 | 115.9 | $137,812 |
Adjusted salary = nominal salary × (100 / CoL index). CoL index: 100 = national average. Lower index = lower cost of living.
Salary by Experience Level in New York
| Experience Level | Estimated Annual |
|---|---|
| Entry Level (0-2 years) | $92,698 |
| Mid Career (3-7 years) | $158,339 |
| Experienced (7+ years) | $250,357 |
Estimates based on BLS percentile data averaged across New York metro areas. Individual pay varies by employer, certifications, and specialization.
All 39 Cities in New York
| # | City | Median Salary |
|---|---|---|
| 1 | New York | $163,404 |
| 2 | Poughkeepsie | $159,724 |
| 3 | Kiryas Joel | $157,302 |
| 4 | Newburgh | $153,885 |
| 5 | Rochester | $139,555 |
| 6 | Troy | $138,141 |
| 7 | Syracuse | $137,300 |
| 8 | Albany | $135,460 |
| 9 | Yonkers | $135,310 |
| 10 | New Rochelle | $132,520 |
| 11 | Schenectady | $132,517 |
| 12 | Buffalo | $131,912 |
| 13 | Mount Vernon | $131,037 |
| 14 | Long Beach | $130,028 |
| 15 | Ithaca | $129,976 |
| 16 | Niagara Falls | $129,957 |
| 17 | Spring Valley | $128,563 |
| 18 | White Plains | $128,394 |
| 19 | Jamestown | $128,237 |
| 20 | Valley Stream | $128,032 |
| 21 | Middletown | $127,499 |
| 22 | Hempstead | $127,360 |
| 23 | Saratoga Springs | $126,732 |
| 24 | North Tonawanda | $125,984 |
| 25 | Auburn | $125,370 |
| 26 | Freeport | $125,012 |
| 27 | Elmira | $124,858 |
| 28 | Oswego | $123,715 |
| 29 | Lackawanna | $123,457 |
| 30 | Amsterdam | $123,398 |
| 31 | Oneonta | $123,100 |
| 32 | Glens Falls | $121,963 |
| 33 | Plattsburgh | $121,830 |
| 34 | Cortland | $121,463 |
| 35 | Utica | $118,923 |
| 36 | Binghamton | $118,871 |
| 37 | Rome | $117,710 |
| 38 | Watertown | $107,309 |
| 39 | Kingston | $105,344 |
More New York Salary Data
Hourly Rates
Explore construction manager hourly pay in New York cities.
Senior / Experienced
Top earner salaries for experienced construction managers.
Compare Cities in New York
View all comparisons →Explore More Construction Manager Salary Data
Frequently Asked Questions
How much do construction managers make in New York in 2026?
What is the highest paying city for construction managers in New York?
How does New York construction manager pay compare to the national average?
What is the entry-level construction manager salary in New York?
How many construction managers are employed in New York?
Which New York city offers the best value for construction managers?
Written by Michael Johnson, MS, CCM
Career Analyst
Michael has 10 years of experience in construction management. He specializes in project scheduling and cost control. He works with a mid-sized general contracting firm.
Methodology & Data Source
Statewide salary figures on this page are 2026 projections based on the Bureau of Labor Statistics Occupational Employment and Wage Statistics (OEWS) survey, May 2026 release. A 3.42% compound annual growth rate (CAGR), derived from 6-year national BLS wage trends, was applied to each metro area's reported salary to estimate current 2026 construction manager compensation across New York. State averages are employment-weighted across 39 metro areas — larger metro areas with more construction managerscontribute proportionally more to the average, producing figures that better reflect typical compensation. Individual pay varies by city, employer, certifications, and experience.
Data Sources & Methodology
Source: BLS, OEWS, 7-year dataset (–). Per-city data from annual BLS metropolitan area surveys.
2026 figures are projected from 2025 BLS data using a compound annual growth rate (CAGR) of 3.42%, derived from historical BLS wage trends for construction managers (SOC 11-9021).
Compiled and verified by Michael Johnson, MS, CCM, a licensed construction manager with 10+ years of clinical experience. · View source data at BLS.gov